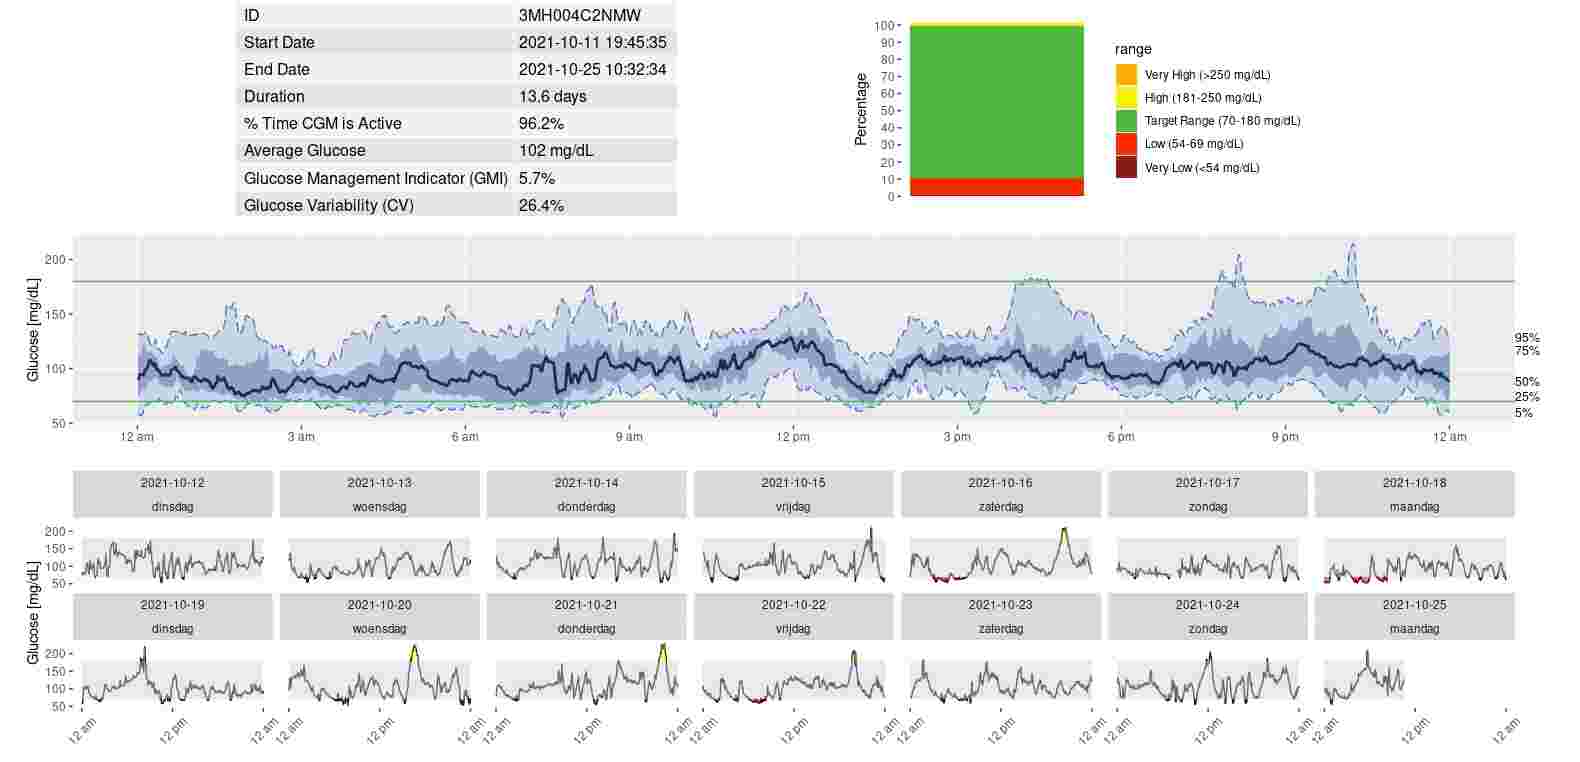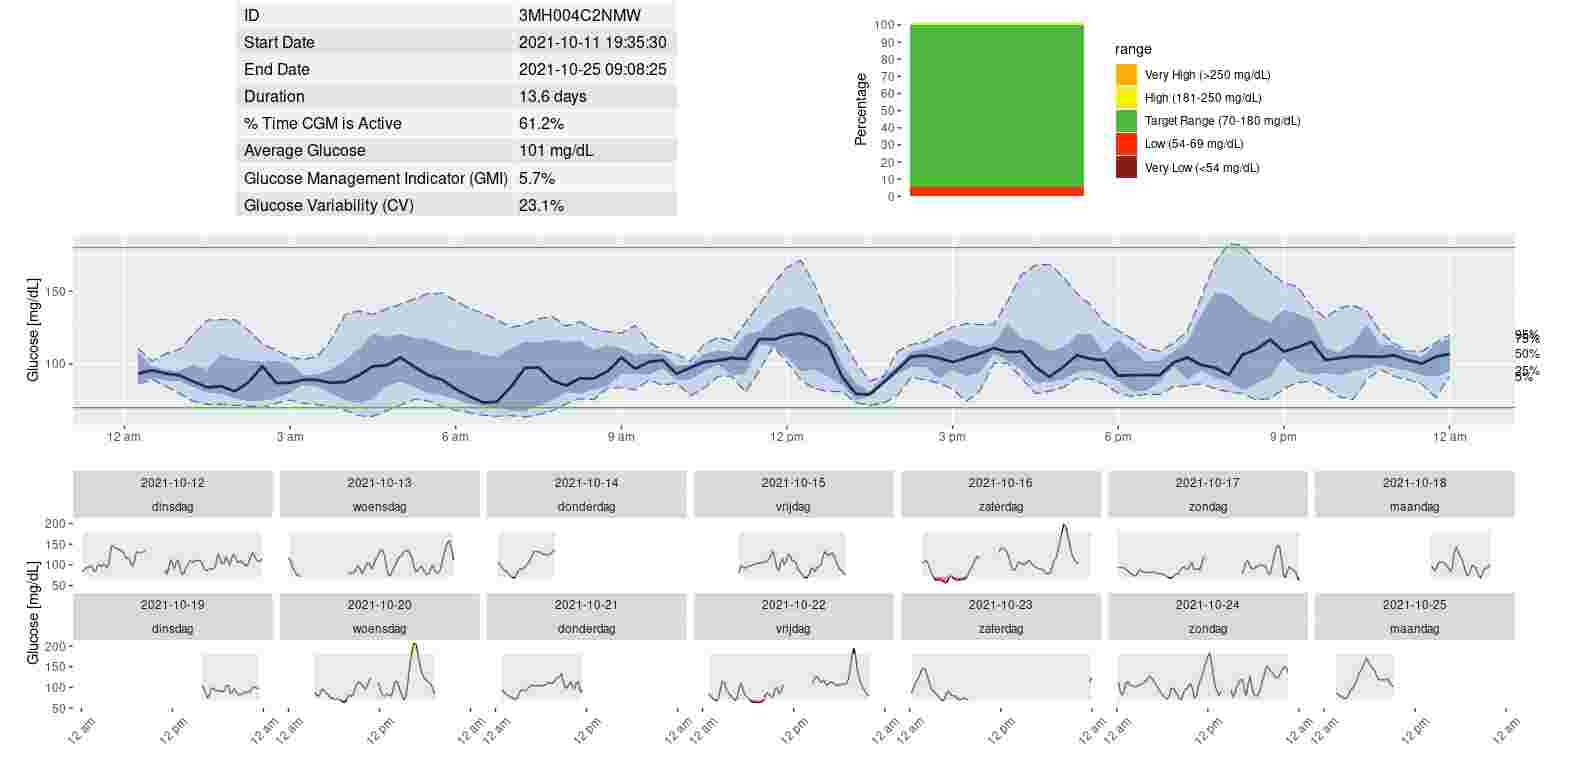
Juggluco let you export continuous glucose monitoring values. Here I describe how you can use these data to generate a picture of your glucose percentiles with the R package Iglu.
First you have to save your streaming data. In Juggluco for Android you can select Export from the left middle menu and press Stream to save it in some file. You need to save in mg/dL so before you save it you should set mg/dL in Settings. The resulting graph is also in mg/dL. This file you can then transfer to your computer.
You can also run Juggluco server on your computer.
Set unit to mg/dL:
juggluco -G
If the data are transferred to the computer, you can press
juggluco -B filename
to save the stream data to filename. See https://www.juggluco.nl/Juggluco/cmdline/index.html for more information about cmdline juggluco.
First you have to install the statistics computing language R and preferentially Rstudio which are both freely available on the web. The only drawback is that the installation takes a lot of time.
Under ubuntu (which also runs under Windows 10), you can press
apt install R-base r-cran-devtools libcurl4-openssl-dev libssl-dev gfortranRstudio you get from here: https://www.rstudio.com/products/rstudio/download/
Now you have to install some packages, which also can take ages and you have to answer questions or press return in between:
install.packages("devtools", dependencies = TRUE)library("devtools")install.packages("iglu", dependencies = TRUE ) install.packages("tidyverse", dependencies = TRUE)
And say that you use them:
library("tidyverse")
library(iglu)
Use for directory the full name of your current directory, for stream.tsv the file you have your stream data in and for 3MH0042XDKM the name of the sensor you want to show.
setwd("directory")
streamdata<-read.table("stream.tsv",header=TRUE,sep='\t',check.names=FALSE);

#If you have turned on the web server in Juggluco (left menu->Settings->|Exchange data->Web server) with Local only unset,
#you can also use:
#streamdata<-read.table("http://192.168.1.69:17580/x/stream?header&mg/dL&days=5",header=TRUE,sep='\t',check.names=FALSE);
#You should replace 192.168.1.69 with the IP of your phone in your home network.

cgmdata<-data.frame(streamdata$Sensorid,as.POSIXct(streamdata$UnixTime, origin="1970-01-01"),streamdata$'mg/dL')
colnames(cgmdata)[1]<-"id"
colnames(cgmdata)[2]<-"time"
colnames(cgmdata)[3]<-"gl"
unique(cgmdata$id)              # to see the sensor id's
agp(dplyr::filter(cgmdata,id=="3MH0042XDKM"))       # display one particular sensor
If you want the analyze a period that is not restricted to a single sensor, you can do the following:
cgmdata2<-data.frame("Name",as.POSIXct(streamdata$UnixTime, origin="1970-01-01"),streamdata$'mg/dL')
colnames(cgmdata2)[1]<-"id"
colnames(cgmdata2)[2]<-"time"
colnames(cgmdata2)[3]<-"gl"

agp(dplyr::filter(cgmdata2,time>="2023-10-01"&time<"2023-12-24"))
Replace 2023-10-01 with the start date and 2023-12-24 with the end date.
Using the history data is identical. To get the history data from the web server in Juggluco, you do something like:
history<-read.table("http://192.168.1.64:17580/x/history?header&mg/dL&days=14",header=TRUE,sep='\t',check.names=FALSE);
Where you replace 192.168.1.64 with the ip of your phone and 14 with the number of days you want to analyze.
Later you can put the above in file and run it by opening it in rstudio, select everything and press run. To see the display, press on the plots penal at the right side. Resize it so everything is visible and save it with export. You can also cut and past to command line R, but adjusting the size of the image is then more difficult.